The order book is a list of currently open buy or sell orders, sorted by their quoted price and volume. Every broker and exchange maintains the order book. It can often be read by API functions and evaluated for getting an overview of the current market situation, as well as of the expected price trend when buy and sell orders are heavily imbalanced.
The following functions can be used for retrieving order book data - also referred to as "market depth", "DOM", or "level 2" data - from the broker or from historical .t2 data files. The data can be directly used for analyzing the order flow from the distribution of quotes and their volumes in the order book (Zorro S required).
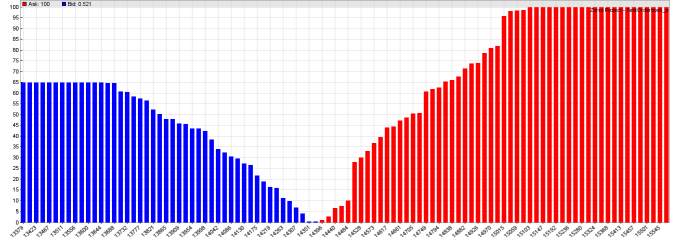
The above histogram is generated from a order flow distribution analysis. The height of a bar is the cumulative volume of a price in the order book, blue for
bid and red for ask prices. The volume is expressed as a 0..1 percentage of the
total ask or bid volume, whichever is higher. You can see that the situation in
the diagram is dominated by offers (100% vs. 65%), which might indicate a
further falling bitcoin price.
| Name | Name of the order book file, without the trailing ".t2" and without a year number, or 0 for using the current asset name. |
| Handle | Handle of the dataset to receive the order book data. |
| Quotes | List of quotes in T2 format. |
| N | Number of quotes. |
| Distance | Maximum order book range. |
| Price | Quote price. |
// plot an order flow profile
void main()
{
  StartDate = 20180110;
  LookBack = 0;
  BarPeriod = 10;
  PlotScale = 10;
  set(PLOTNOW);

  assetList("AssetsCrypto");
  asset("BTC/USD");

// load today's order book
  int N = orderUpdate("BTCUSD",1);
  T2* Quotes = dataStr(1,OrderRow,0);
  printf("\nOrderbook: %i quotes",N);

  var Distance = 0.05*price(); // +/- 5%
  int N2 = orderCVD(Quotes,N,Distance);
  printf(", %i in range",N2);
  Distance *= 1.5;
  var Price = priceClose() - Distance;
  int i;
  for(i=0; i<100; i++) {
    Price += Distance/50;
    plotBar("Ask",i,Price,cpd(Price),BARS|LBL2,RED);
  }
  Price = priceClose() - Distance;
  for(i=0; i<100; i++) {
    Price += Distance/50;
    plotBar("Bid",i,Price,cpd(-Price),BARS|LBL2,BLUE);
  }
}
► latest version online