Zorro's advise function can be used for applying machine learning functions to candle patterns, and using the most profitable patterns for a trade signal. Here's a simple example (Workshop7.c):
function run()
{
  StartDate = 2010;
  EndDate = 2018;
  BarPeriod = 1440;   // 1 day
  NumWFOCycles = 5;   // WFO is mandatory for machine learning functions

  set(RULES,TESTNOW); // generate rules, test after training
  if(Train) Hedge = 2; // train with long + short trades
  if(!Train) MaxLong = MaxShort = 1; // only 1 open trade
  LifeTime = 1;        // 1 day prediction horizon

  if(adviseLong(PATTERN+2+RETURNS,0,
    priceH(2),priceL(2),priceC(2),
    priceH(1),priceL(1),priceC(1),
    priceH(1),priceL(1),priceC(1),
    priceH(0),priceL(0),priceC(0)) > 50)
    enterLong();
  if(adviseShort() > 50)
    enterShort();
}
Many lines in this code should be familiar, but there are also some new concepts. The adviseLong function takes price candles or other data, and generates a trade signal when the return value is above a threshold. It can be called like a normal indicator, but internally uses various machine learning training and prediction algorithms. The function is here called with the PATTERN classification method and the High, Low, and Close prices of the last 3 candles, split in two groups. The RETURNS flag uses the return of the following trade for training. Aside from PATTERN, other and more complex machine learning methods can be used, such as a deep learning neural net. A more detailed introduction in pattern detection with adviseLong/Short can be found in the Black Book. An application for deep learning is described in this article.
WFO or some other out-of-sample test method is mandatory for machine learning or pattern classification strategies. All machine learning systems tend to overfitting, so any in-sample result from price patterns, decision trees, or preceptrons would be far too optimistic and thus meaningless. The number 5 is a compromise: higher numbers produce more WFO cycles, ergo less bars for any cycle to train, so less patterns are found and the results deteriorate. Lower numbers produce more bars per cycle and more patterns are found, but they are from a longer time period - above one year - within which the market can have substantially changed. So the results can deteriorate, too.
The RULES flag is required for generating price patterns with the advise function. TESTNOW runs a test automatically after training - this saves a button click when experimenting with different pattern finding methods.
The next code line behaves differently in training and in test or trade mode:
if(Train) Hedge = 2;
Train is true in [Train] mode. In this mode we want to determine the profitability of a trade that follows a certain pattern. Hedge is set to 2, which allows long and short positions at the same time. This is required for training the patterns, otherwise the short trade after adviseShort would immediately close the long positions that was just opened after adviseLong, and thus assign a wrong profit/loss value to its candle pattern. Hedge is not set in test and trade mode where it makes sense that positions are closed when opposite patterns appear.
LifeTime sets the duration of a trade to 1 bar, i.e. 1 day. The trade results are also used for training the candle patterns and generating the trade rules. MaxLong/MaxShort limit the number of open trades in test or trade mode to 1.
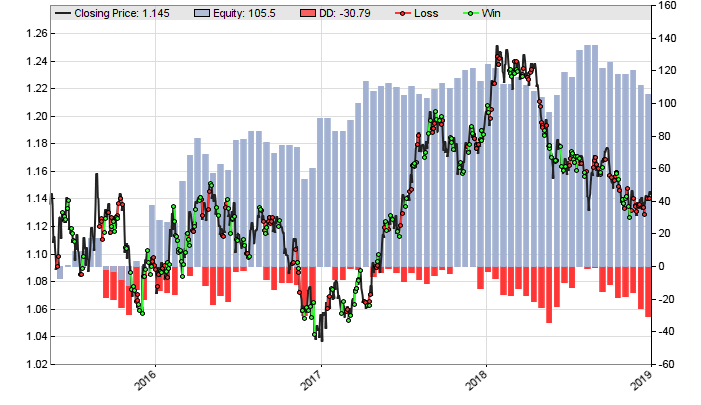
Click [Train]. Depending on the PC speed, Zorro will
need a few seconds for running through the 5 WFO cycles and finding about 30 profitable
long or short patterns in every cycle. Click [Result]
for the equity curve:
The machine learning algorithm with daily candle patterns seems to give us a more or less rising equity curve and symmetric results in long and short trading. But can the same result be achieved in live trading? Or was it just a lucky setup? For finding out, you can apply a Reality Check with a Monte Carlo arlgorithm. There are several methods; a frequently used one is running the test many times (use NumTotalCycles) with a randomized price curve (Detrend = SHUFFLE), plotting a histogram of the results, and comparing it with the result from the real price curve. How to do such a reality check is covered in the Black Book. If you do that, you'll find that the system above will not pass the test.